0

00-vaccine-homesvg
icon-vialspng
icone-freezrpng
Icon-bar-chartpng
Icon-Seryngepng
Icon-Chemicals0

Click to discover the infographics

Animation_barsgif
Clicksvg
Icon-Chemicals1

Top exporters of ingredients  

Stabilisers

Preservatives

Share in global exports (%), 2018
Source: Using trade to fight COVID-19: Manufacturing and distributing vaccines, Fig. 4, OECD 2021. 

Antibiotics

(e.g. aluminium salts)

(e.g. sorbitol)

(e.g. thimerosal)

(e.g. neomycin)

Mexico 11.4%

France 36.4%

China 13.3%

China 23.1%

Switzerland 17%

Italy 9.4%

Germany 12.5%

Germany 17.2%

Argentina 13%

India 12%

China 11.1%

Turkey 9.1%

ArrowR1

Adjuvants

02-syringes-and-needlessvg

Share in global exports (%), 2018
Source: Using trade to fight COVID-19: Manufacturing and distributing vaccines, Fig. 4, OECD 2021. 

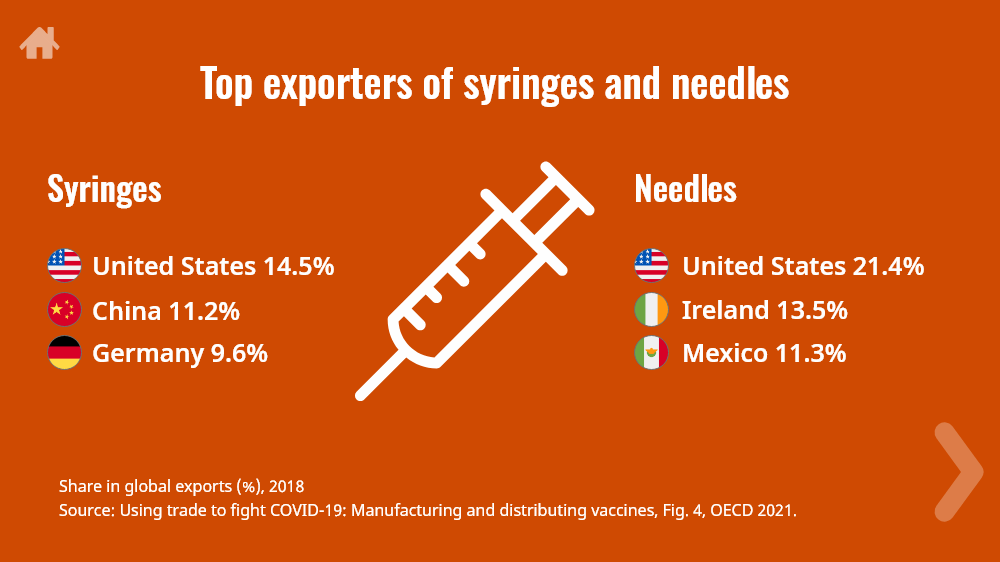
Top exporters of syringes and needles 

03-stoppers-and-vialspng

Share in global exports (%), 2018
Source: Using trade to fight COVID-19: Manufacturing and distributing vaccines, Fig. 4, OECD 2021. 

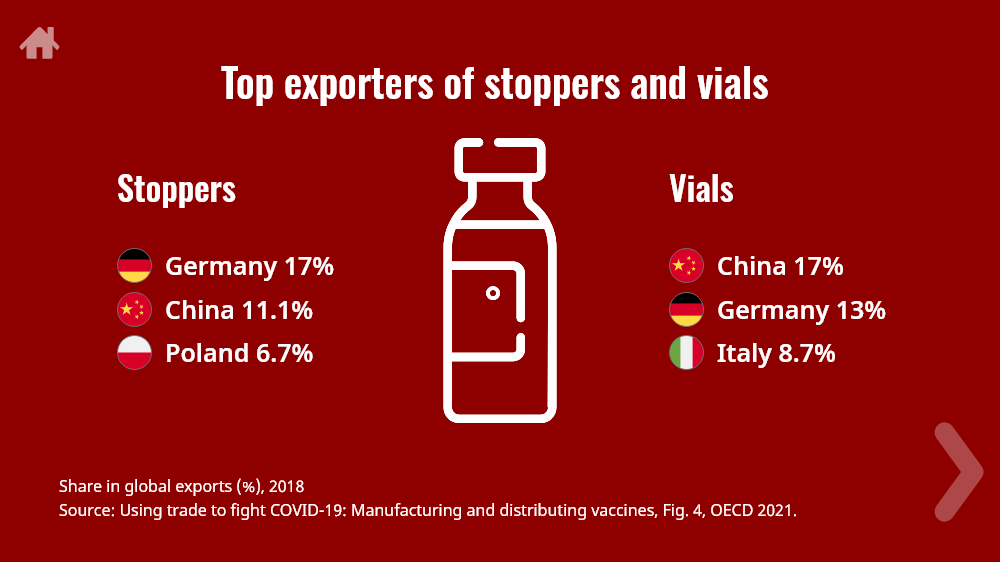
Top exporters of stoppers and vials

04-storages-itemspng

Share in global exports (%), 2018
Source: Using trade to fight COVID-19: Manufacturing and distributing vaccines, Fig. 4, OECD 2021. 

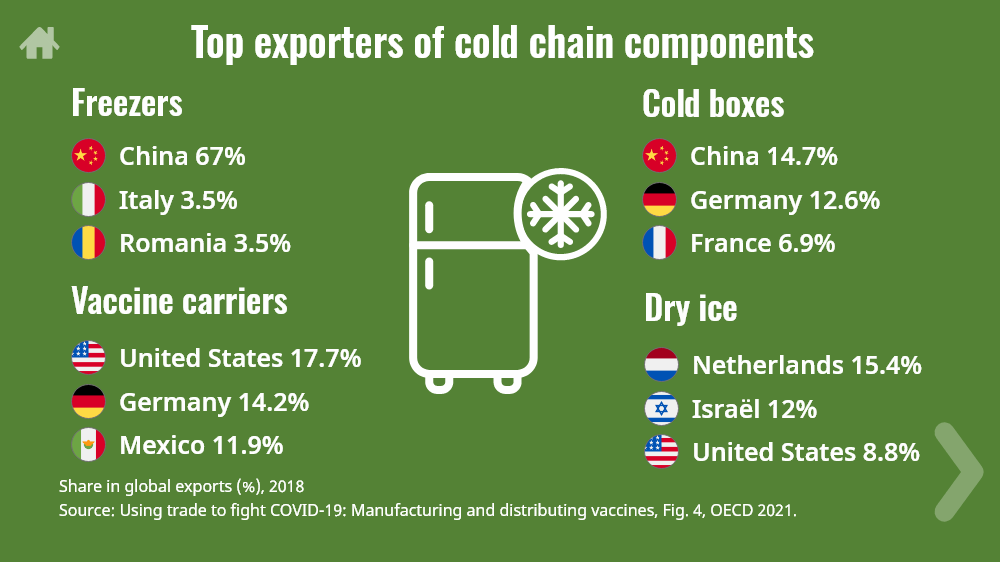
Top exporters of cold chain components

Top-exporters-2018svg

Source: Using trade to fight COVID-19: Manufacturing and distributing vaccines, Fig. 4, OECD 2021. 

icon home1
icon home2
icon home3
icon home4
icon home5
Flags1Lupsvg
Flags1Lbottomsvg
Flags1Rupsvg
Flags1Rbottomsvg